
Tom Davies
CHAPS is a critical element of the UK’s payments landscape, handling 92% of UK payment values despite comprising 0.5% of volumes. CHAPS is used for high-value and time-critical payments, including money market and foreign exchange transactions, supplier payments, and house purchases. We forecast CHAPS volumes to help CHAPS participants in making staffing decisions and support our long-term planning including system capacity and tariff setting. While advanced forecasting methods can capture subtle, non-linear patterns, a tension arises: should we use complex models for the most accurate prediction, or use simpler, transparent approaches that stakeholders can quickly grasp? In practice, forecasting isn’t as straightforward as picking whichever model maximises performance; it is the combination of computation and domain expertise that shapes success.
While this debate is not new, the rise of advanced techniques such as gradient boosting, deep neural networks, and ensemble approaches has made it even more important for policymakers. These methods can scour vast data sets and promise tangible improvements in predictive performance. Thanks to the growing accessibility of high-performance computing, advanced models can now be swiftly deployed, enabling on-demand forecasts.
However, the story doesn’t end with improved performance. In a fluctuating volume environment like CHAPS, what if analysts or decision-makers can’t pinpoint why the model expects, say, a sudden 10% spike in volumes on a Wednesday? This emphasis on forecast scrutiny echoes comments by Bernanke and many others, who contend that the best real-world model is not necessarily the one with the absolute lowest error. When operational decisions depend on forecasts, a model that operates as a black box or does not face robust evaluation, can erode trust. Straightforward models – like linear regressions or moving averages – rarely match the precision of cutting-edge machine learning algorithms but excel at transparency. These less complex models can also mitigate overfitting, which occurs when a model learns its training data and noise too well. These trade-offs are especially pertinent for CHAPS forecasts that influence various operational decisions. In some instances, even small accuracy gains matter, but accountability and clarity often outweigh raw performance. To balance these needs, we employ a hybrid strategy: each day, a simpler, regression-based model provides a transparent baseline forecast for immediate operational tasks, while advanced models are available to run in the background, searching data for nuanced anomalies and subtle higher-order interactions. If discrepancies persist, we can consult the ensemble or neural network to glean insights that the simpler model may be missing – such as a rare interaction of different drivers. For example, imagine a model that consistently forecasts a 10% post-holiday surge. In parallel, our deep learning models detect this surge also coincides with an international market closure, producing a more informed effect that offers deeper insight. This layered approach enables immediate, understandable forecasts while retaining the ability to uncover and address complex interactions.
Our work in this space has demonstrated that blending domain expertise with data-driven methods always strengthens the forecasting process. Local expertise on payment holidays, housing seasonality, money markets and the intricacies of settlement behaviour regularly adds value. Seasonal and cross-border factors also loom large: bank holidays may consolidate payments into fewer working days, and closures overseas can spill into UK activity. Roughly 52% of CHAPS traffic flows internationally. While these payments settle in sterling in CHAPS, they can be initiated by, or ultimately destined for, overseas accounts. Therefore, a US holiday like Presidents’ Day or a TARGET2 holiday such as Labour Day can alter CHAPS volumes significantly. Without this expertise it is difficult to build any model and avoid spurious correlations. The models can then subsequently quantify the impact of these drivers in real numbers and percentages. More sophisticated machine learning techniques shine at detecting multiple interactions that are hard for people to see – perhaps it sees that a European holiday combined with US quarter-end leads to a mid-week peak.
Over time, the combination of advanced analytics and real-world understanding builds a virtuous cycle: anomalies lead to deeper investigation, which refines both the complex and simple models, boosting forecast resilience. That resilience underpins broader system stability, reinforcing the trust of direct participants and end-users who rely on CHAPS for timely, predictable settlements.
Chart 1: The relationship between model complexity and forecast accuracy across our CHAPS Daily Forecast Models
Note: Blue dots represent models with optimal hyperparameters that achieved the lowest mean absolute percentage error (MAPE).
As demonstrated by Chart 1, the trade-off between more complex models and simpler ones emerged clearly when forecasting CHAPS volumes. We ranked our models on the x-axis according to a (very) rough assessment of their complexity and compared their mean absolute percentage error (MAPE). As expected, the most complex deep-learning and gradient-boosting approaches delivered the best results. As you can see, the ensemble model that combined an optimised XGBoost model and a hyperparameter-tuned neural network outperformed our multiple linear regression model. Using a training-test split to calculate the root mean squared error (RMSE), the ensemble reduced the RMSE by 13% and explained 97% of the day-to-day variability.
Furthermore, Chart 1 shows as model complexity rose, the marginal gains in performance diminished. Each complex model required careful interpretation, additional training overhead, and specialised monitoring. When weighed against the operational need for clear, daily explanations, we found that interpretability frequently outweighed marginal gains in raw accuracy. This was particularly important when teams needed to justify decisions in real time: having a readily understandable model helped sustain confidence and facilitated cross-functional collaboration.
From this perspective, the regression model provides a clear lens on the key drivers of day-to-day traffic and allows us to ask the important question: which volume drivers truly matter for day-to-day CHAPS forecasts? A common assumption might be that macroeconomic indicators dictate near-term payment activity. However, fluctuations correlate more strongly with calendar effects, structural processes, and sector-specific events. This is because the key statistical problem is determining which days payments are made on, rather than the overall payments need in the economy.
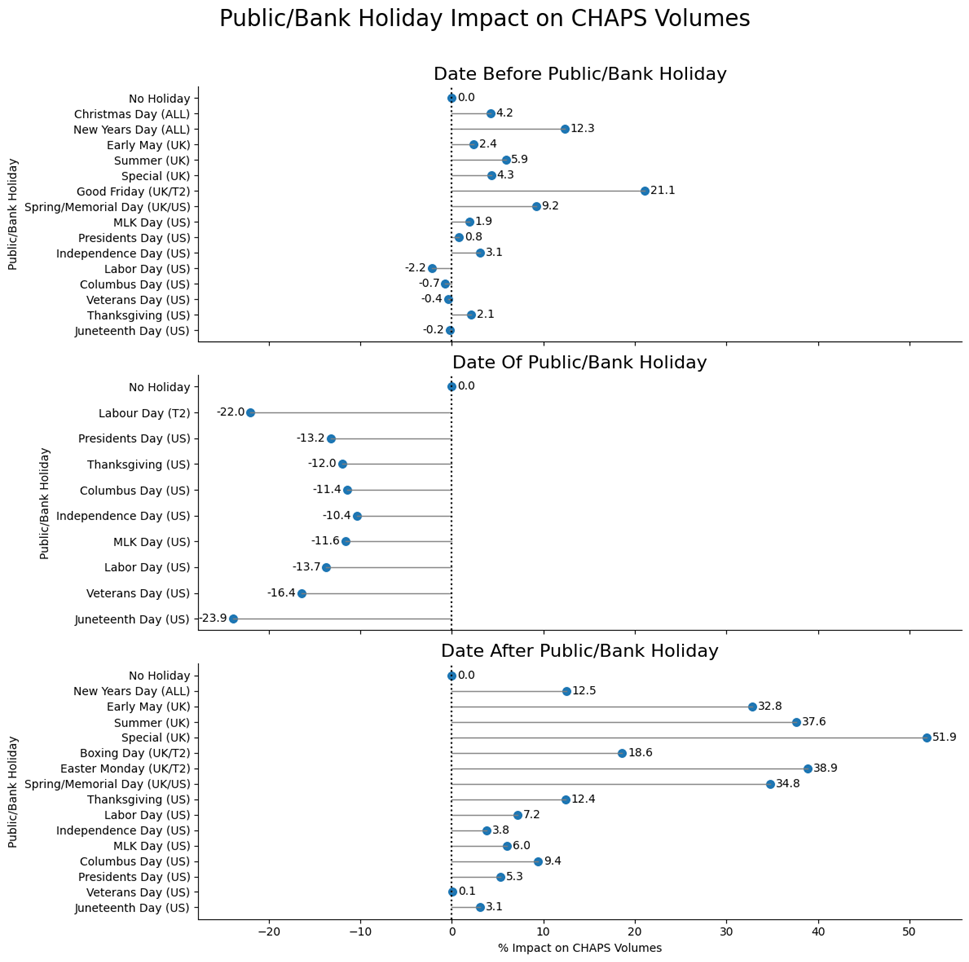
Chart 2: Sample of regression models’ coefficients (in %) indicating change in volumes by public/bank holiday
Note: ‘Special’ refers to bank holidays in the UK that are related to royal events or are not part of the traditional bank holiday calendar.
Chart 2 shows the impact of specific holiday-related features. This simpler regression-based approach makes it relatively easy to demonstrate how, for example, the first working day of the month correlates with a 19% rise in daily volumes, or that the date after an international holiday consistently adds ~5%–10% to typical levels. By highlighting these drivers, analysts give operational teams a firm basis for decisions: for example, ‘Expect heavier traffic on Tuesday since Monday is a bank holiday’. A complex algorithm can detect the same phenomenon but communicating it may require advanced interpretability methods such as Shapley values (for more details see the Bank of England’s working paper on Shapley regressions), local interpretable model-agnostic explanations (LIME), or partial dependence plots. These methods can break down a neural network’s forecast into contributions from each variable, explaining precisely why, for example, Monday’s surge is attributed 60% to cross-border factors and 40% to domestic cyclical peaks. Yet, these methods demand additional expertise and time – luxuries that might be scarce when volumes spike unexpectedly. If staff must rapidly justify why a forecast soared by X%, a direct, coefficient-based explanation is more efficient than dissecting partial dependence curves, especially outside a dedicated data science team.
Our conclusions have important implications for our policymakers, operational teams and CHAPS participants. Having accurate, yet explainable, models help us to understand the CHAPS ecosystem and the drivers of volume. Our policymakers will use this to help set our medium-term strategy as operator of RTGS and CHAPS. Our operational teams will be confident that the system can deal with any future peaks in volume. Finally, our CHAPS participants, and operational teams will have the certainty they require to staff and monitor their systems effectively.
All told, our experience underscores how advanced methods and simpler regressions can coexist. By merging domain knowledge, selective model complexity, and robust communication, we have ensured that our CHAPS forecasting remains aligned with these factors. In reviewing our existing forecast, we evaluated the model’s methodology, including its feature engineering pipeline, data sourcing and validation processes. Building on these insights, we then adopted an agile development process, iterating rapidly to refine new solutions that weighed the trade-off between complexity, clarity and performance at each stage. Since implementing the hybrid approach, we have more readily identified emergent patterns and explicitly incorporated them into our models. Over time, as data volumes grow, the ability to adapt swiftly without losing the thread of causation will keep forecasting efforts aligned with operational and policy goals. Ultimately, the best forecasting approaches for CHAPS are those that do more than just crunch numbers effectively: they bring stakeholders along; reveal the pivotal drivers behind day-to-day trends; and support well-informed, timely actions. Building on these lessons, we plan to extend our refined approach beyond daily CHAPS forecasts. As the techniques available to us become inevitably more sophisticated, the imperative that underpins our work remains the same: forecasting must be both accurate and intelligible, lest its value be lost in opaque conclusions.
Tom Davies works in the Bank’s Payments Strategy Division.
If you want to get in touch, please email us at [email protected] or leave a comment below.
Comments will only appear once approved by a moderator, and are only published where a full name is supplied. Bank Underground is a blog for Bank of England staff to share views that challenge – or support – prevailing policy orthodoxies. The views expressed here are those of the authors, and are not necessarily those of the Bank of England, or its policy committees.
Share the post “Balancing complexity and performance in forecasting models: insights from CHAPS volume predictions”
Publisher: Source link


